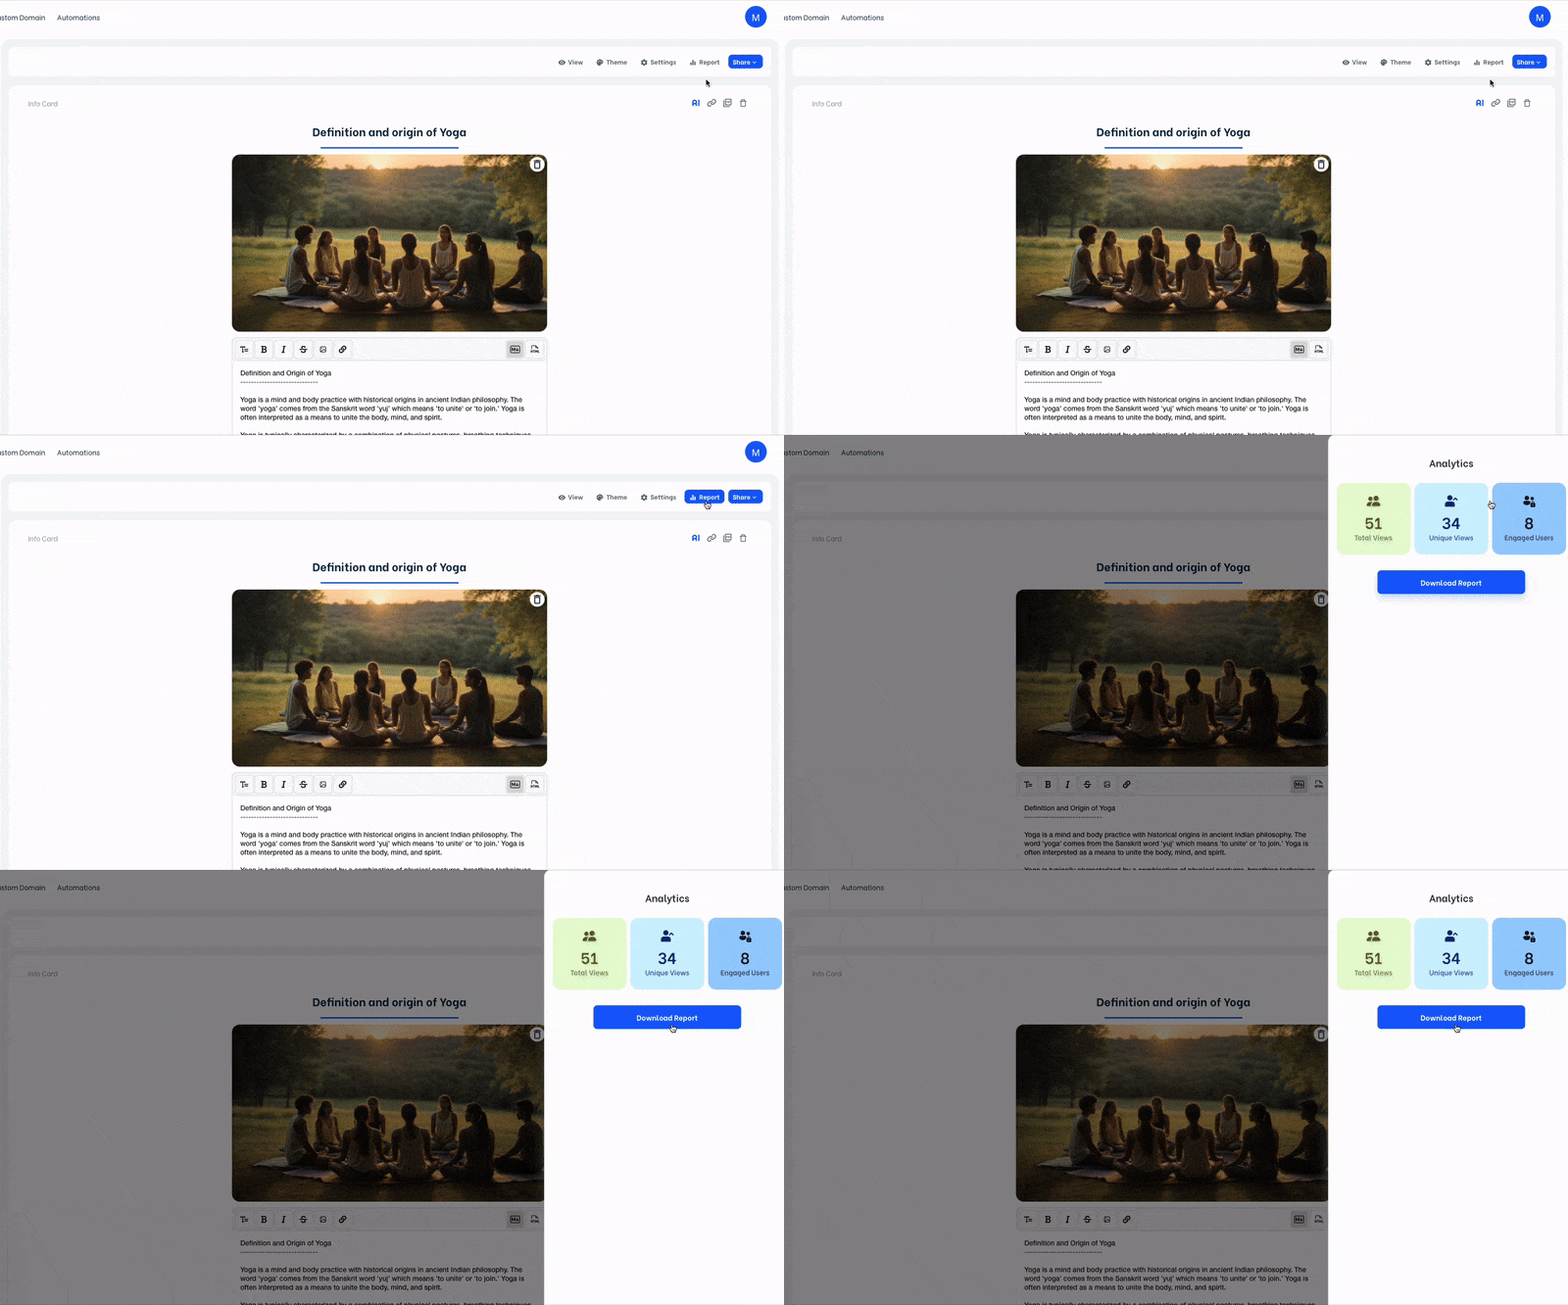
Mini Course Generator provides an analytics report in .xls format for each of your mini-courses. This report includes the answers given to the quiz questions in your mini-course, the responses provided in the feedback cards, and more valuable information such as the last date and time the learner accessed the mini-course.
To get this report, click on “Report” on top right end of your mini-course editor screen and “Download Report”.

You can also download this report by clicking the “Analytics” button of the mini-course on your admin dashboard.

You will find the inputs to your cards from individual learners in this report. It is also possible to know how many and which cards have been completed by every learner. In brief, analytics report of a mini-course enlightens about its completion rates and in which step users have left it.
In addition to single mini-course analytics, you can get an analytics report at collection level as well. Visit our Analytics of the Overall Collection article to learn more.
Want to see Mini Course Generator’s learning analytics features in action? Watch our quick walkthrough video below to explore how Mini Course Generator helps you leverage learning analytics to enhance course creation and learner engagement!
Note: If you do not want to download a report manually to see new data, you can automate updating a spreadsheet with your learner data instead. It is possible to integrate your mini-course to a Google spreadsheet with a webhook you will create on Pipedream. Learn more.
Haven’t you signed up yet?
Join thousands of professionals in achieving more by creating mini-courses. Explore now!


